Make a chart with Csharp and ZedGraph
Ok so we don't start with the official microsoft widget but I choose a small lib called ZedGraph
Assuming you've already code using C# and you already know a little bit about user interface.
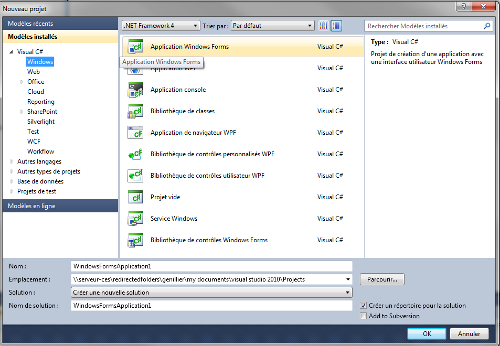
Firstly you need to launch Visual Studio and create a new project.
Choose Windows Application Form :
Then add a reference :
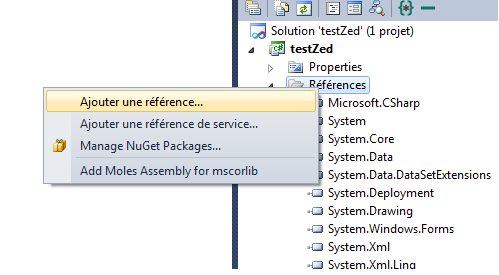
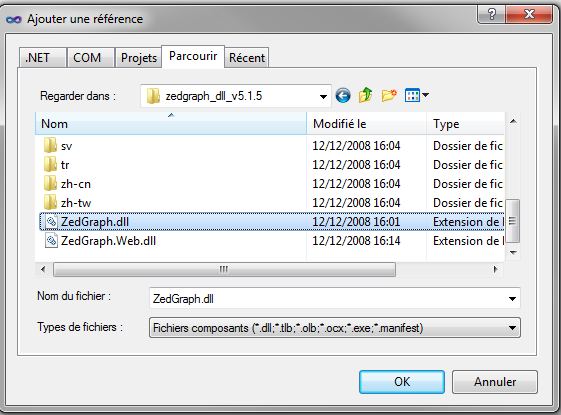
Then add reference to ZedGraph.dll :
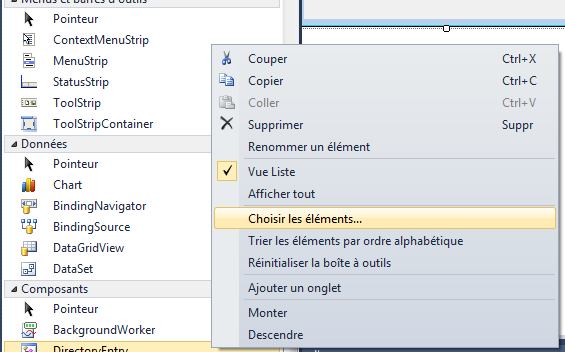
Then you need to print the toolbox and add the item (widget) to handle ploting stuff (what we are looking for in fact).
So right click on the toolbox and choose add item :
You're now ready to add the ZedGraph widget on the form. This is the area where we will generate the plot :
Now your install of ZedGraph is done. We start the coding part and you will see it's really easy :
A big part of this code is inspired from an example found on this tutorial be sure to read it.
Assuming you have done all the things correctly, here's the plot you will get :
You will get :

Assuming you've already code using C# and you already know a little bit about user interface.
Firstly you need to launch Visual Studio and create a new project.
Choose Windows Application Form :
Then add a reference :
Then add reference to ZedGraph.dll :
Then you need to print the toolbox and add the item (widget) to handle ploting stuff (what we are looking for in fact).
So right click on the toolbox and choose add item :
You're now ready to add the ZedGraph widget on the form. This is the area where we will generate the plot :
Now your install of ZedGraph is done. We start the coding part and you will see it's really easy :
using System;
using System.Collections.Generic;
using System.ComponentModel;
using System.Data;
using System.Drawing;
using System.Linq;
using System.Text;
using System.Windows.Forms;
using ZedGraph;

namespace testZed
{
    public partial class Form1 : Form
    {
        public Form1()
        {
            InitializeComponent();
        }

        private void Form1_Resize(object sender, EventArgs e)
        {
            SetSize();
        }

        private void SetSize()
        {
            zedGraphControl1.Location = new Point(10, 10);
            zedGraphControl1.Size = new Size(ClientRectangle.Width - 20, ClientRectangle.Height - 20);
        }

        private void Form1_Load(object sender, EventArgs e)
        {
            // Setup the graph
            CreateGraph(zedGraphControl1);
            // Size the control to fill the form with a margin
            SetSize();
        }

        private void CreateGraph(ZedGraphControl zgc)
        {
            // get a reference to the GraphPane
            GraphPane myPane = zgc.GraphPane;

            // Set the Titles
            myPane.Title.Text = "Sample graph using ZedGraph";
            myPane.XAxis.Title.Text = "X axis";
            myPane.YAxis.Title.Text = "Y Axis";

            double x, y1, y2;
            PointPairList list1 = new PointPairList();
            PointPairList list2 = new PointPairList();
            for (int i = 0; i < 20; i++)
            {
                x = (double)i + 1;
                y1 = Math.Sin((double)i);
                y2 = (Math.Cos((double)i));
                list1.Add(x, y1);
                list2.Add(x, y2);
            }

            LineItem myCurve = myPane.AddCurve("Var1", list1, Color.Red, SymbolType.Square);

            LineItem myCurve2 = myPane.AddCurve("Var2",
                  list2, Color.Blue, SymbolType.Triangle);

            zgc.AxisChange();
        }

        private void zedGraphControl1_Load(object sender, EventArgs e)
        {
        }
    }
}
A big part of this code is inspired from an example found on this tutorial be sure to read it.
Assuming you have done all the things correctly, here's the plot you will get :
You will get :
Using the Microsoft chart library to create bar chart (or something else)
The method I will explain is coding for dummies, in fact no coding, only designer actions...
But it's simply to start having something working, then you will be able to improve the code to generate better charts (better code for better results).
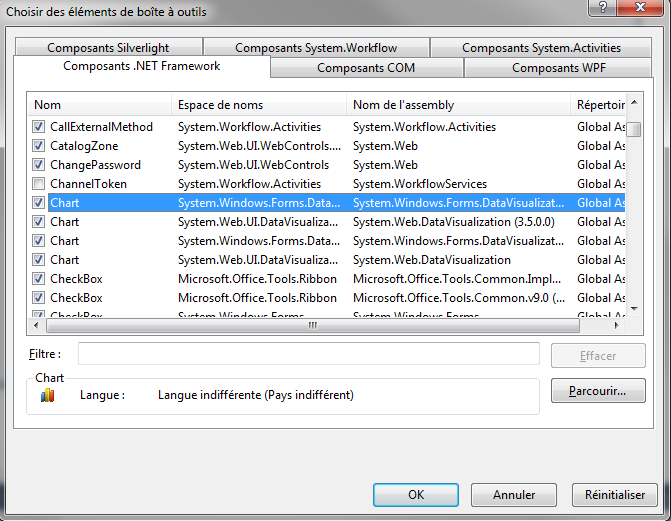
Ok you need to dowload the chart control for .Net (currently : Chart control for .net 3.5). So see below how to create a Windows application form then add chart item :
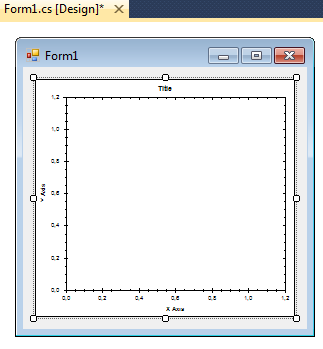
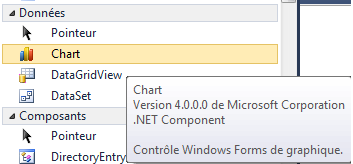
Then you can add the item on the form :
After that, you simply need to play with properties to create the chart you want.
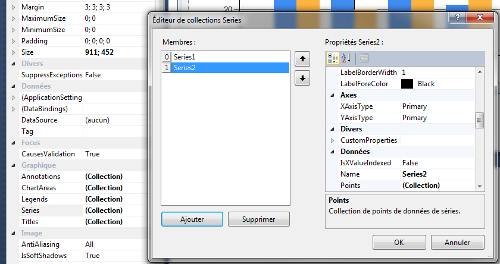
And add series, add points into series, change color, legend. All is done only with the designer !
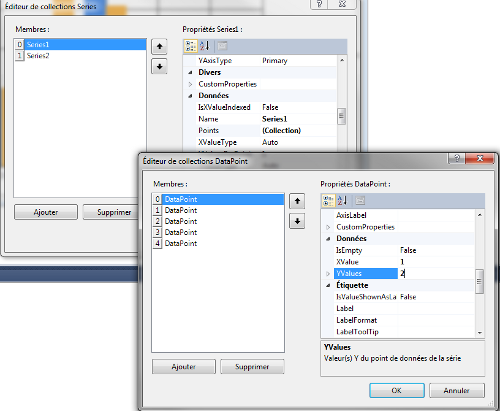
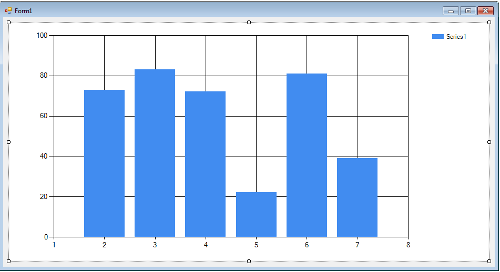
Let's see the result :
 For further information, you could also find documentation and a good tutorial.
But it's simply to start having something working, then you will be able to improve the code to generate better charts (better code for better results).
Ok you need to dowload the chart control for .Net (currently : Chart control for .net 3.5). So see below how to create a Windows application form then add chart item :
Then you can add the item on the form :
After that, you simply need to play with properties to create the chart you want.
And add series, add points into series, change color, legend. All is done only with the designer !
Let's see the result :
For further information, you could also find documentation and a good tutorial.
Create charts in C# with oxyplot chart library
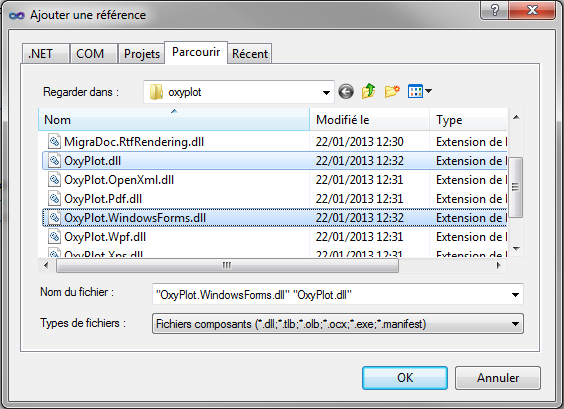
After downloading oxyplot, you need to add a reference to it like this :
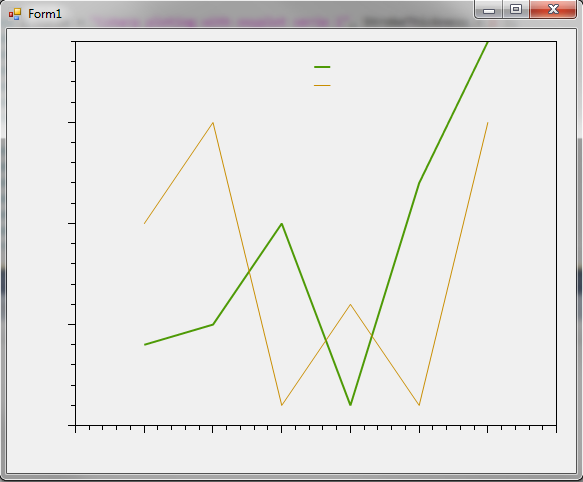
As always I give you a sample code :
See what we get :
As always I give you a sample code :
using System;
using System.Collections.Generic;
using System.ComponentModel;
using System.Data;
using System.Drawing;
using System.Linq;
using System.Text;
using System.Windows.Forms;

using OxyPlot;

namespace WindowsFormsApplication1
{
    public partial class Form1 : Form
    {
        public OxyPlot.WindowsForms.Plot MyPlot;

        public Form1()
        {
            InitializeComponent();

            MyPlot = new OxyPlot.WindowsForms.Plot();
            MyPlot.Model = new PlotModel();
            MyPlot.Dock = DockStyle.None;
            this.Controls.Add(MyPlot);

            MyPlot = new OxyPlot.WindowsForms.Plot();
            MyPlot.Model = new PlotModel();
            MyPlot.Dock = DockStyle.Fill;
            this.Controls.Add(MyPlot);

            MyPlot.Model.PlotType = PlotType.XY;
            MyPlot.Model.Background = OxyColor.FromArgb(0, 200, 200, 200);
            MyPlot.Model.TextColor = OxyColor.FromArgb(0, 50, 50, 50);

            // Create Line series
            var serie1 = new LineSeries { Title = "Csharp ploting with oxyplot serie 1", StrokeThickness = 2 };
            serie1.Points.Add(new DataPoint(1, 4));
            serie1.Points.Add(new DataPoint(2, 5));
            serie1.Points.Add(new DataPoint(3, 10));
            serie1.Points.Add(new DataPoint(4, 1));
            serie1.Points.Add(new DataPoint(5, 12));
            serie1.Points.Add(new DataPoint(6, 19));

            var serie2 = new LineSeries { Title = "Csharp ploting with oxyplot serie 2", StrokeThickness = 1 };
            serie2.Points.Add(new DataPoint(1, 10));
            serie2.Points.Add(new DataPoint(2, 15));
            serie2.Points.Add(new DataPoint(3, 1));
            serie2.Points.Add(new DataPoint(4, 6));
            serie2.Points.Add(new DataPoint(5, 1));
            serie2.Points.Add(new DataPoint(6, 15));

            // add Series and Axis to plot model
            MyPlot.Model.Series.Add(serie1);
            MyPlot.Model.Series.Add(serie2);
            MyPlot.Model.Axes.Add(new LinearAxis(AxisPosition.Bottom, 0.0, 7.0));
            MyPlot.Model.Axes.Add(new LinearAxis(AxisPosition.Left, 0.0, 19.0));
        }

        private void Form1_Load(object sender, EventArgs e)
        {
        }
    }
}
See what we get :